Prometheus Query Language (PromQL) is a powerful tool for extracting insights from Prometheus metrics. Whether you're diagnosing system performance, setting up alerts, or analyzing historical trends, PromQL enables precise data querying and visualization. This comprehensive cheat sheet will guide you from the basics to advanced techniques, with practical examples and tips for performance optimization.
What is PromQL and Why is it Essential for Monitoring?
PromQL (Prometheus Query Language) is the specialized query language designed for Prometheus, the popular open-source monitoring and alerting toolkit. It allows you to select and aggregate time series data in real time, forming the foundation of Prometheus' powerful monitoring capabilities.
Key features that make PromQL indispensable for monitoring include:
- Time series focus: PromQL is optimized for working with time series data, making it ideal for tracking metrics over time.
- Flexible data selection: You can easily filter and group metrics based on labels, allowing for precise data retrieval.
- Built-in functions: PromQL offers a wide range of functions for rate calculations, aggregations, and transformations.
- Alerting integration: PromQL queries form the basis of Prometheus alerting rules, enabling proactive monitoring.
PromQL fits seamlessly into the Prometheus ecosystem, working hand-in-hand with other components like the Prometheus server, Alertmanager, and various exporters. Mastering PromQL empowers you to extract maximum value from your Prometheus deployment.
Quick Reference: Essential PromQL Syntax and Operators
PromQL's syntax is straightforward yet powerful, allowing you to retrieve, filter, and aggregate metrics with precision.
This section provides a quick reference to PromQL's fundamental building blocks, including basic syntax, operators, and essential commands you'll use daily.
Basic Metric Selection and Label Matching
To select metrics in PromQL, use this syntax:
metric_name{label="value"}
- Select all metrics:
http_requests_total - Match specific label:
http_requests_total{status="200"} - Multiple label matchers:
http_requests_total{status="200", method="GET"}
Label matching operators:
=: Exact match!=: Not equal=~: Regex match!~: Regex not match
Example:
http_requests_total{status=~"4.."} # Match all 4xx status codes
Arithmetic Operators
PromQL supports basic arithmetic operations between scalar values and time series:
+: Addition-: Subtraction*: Multiplication/: Division%: Modulo^: Exponentiation
Example:
(node_memory_MemTotal_bytes - node_memory_MemFree_bytes) / node_memory_MemTotal_bytes * 100
Comparison and Logical Operators
Use these operators for filtering and combining time series:
Comparison:
==,!=,<,<=,>,>=
Logical:
and,or,unless
Example:
http_requests_total > 100 and http_errors_total < 5
Time-Based Operators
PromQL allows you to select data over specific time ranges:
- Range vector:
[5m](last 5 minutes) - Offset:
offset 1h(data from 1 hour ago)
Example:
rate(http_requests_total[5m] offset 1h)
Common PromQL Functions Every DevOps Engineer Should Know
PromQL includes a wide range of functions that simplify tasks like rate calculation, data aggregation, and histogram analysis.
Rate Calculations
rate(): Calculate per-second average rate of increaserate(http_requests_total[5m])irate(): Calculate instant rate of increaseirate(http_requests_total[5m])
Aggregation Functions
sum(): Add valuessum(http_requests_total) by (status)avg(): Calculate averageavg(node_cpu_utilization) by (instance)max()andmin(): Find maximum and minimum valuesmax(http_request_duration_seconds) by (endpoint)increase(): Calculates the total increase over a time window.increase(http_requests_total[5m])
Histogram Analysis
histogram_quantile(): Calculate quantiles from histogram metrics
histogram_quantile(0.95, rate(http_request_duration_seconds_bucket[5m]))
Absence Detection
absent(): Check if a metric is missingabsent(up{job="important-service"})absent_over_time(): Check if a metric was absent for a time rangeabsent_over_time(up{job="important-service"}[1h])
Mastering Time Series Selection in PromQL
Time-series data is the backbone of Prometheus, and selecting the right data is key to gaining actionable insights. PromQL provides various mechanisms—instant vectors, range vectors, offsets, and subqueries—to extract and manipulate time-series data effectively.
Instant Vector Selectors
Instant vectors allow you to query the current state of a metric at a specific point in time. For example:
http_requests_total
This retrieves the latest value of http_requests_total for all time series with that metric.
Range Vector Selectors
Range vectors allow you to analyze trends or patterns by selecting data over a specified time window:
http_requests_total[5m]
This fetches all recorded data points for http_requests_total from the last 5 minutes.
Offset Modifier
The offset modifier shifts the time frame of a query, helping you compare past and present metrics:
http_requests_total offset 1h
This selects the value of http_requests_total from 1 hour ago.
Subquery Syntax
Subqueries let you perform advanced calculations over a range of time. For example:
max_over_time(rate(http_requests_total[5m])[1h:])
This computes the maximum rate of http_requests_total over each 1-hour interval, with 5-minute windows for rate calculation.
Advanced PromQL Techniques for Performance Optimization
As your infrastructure grows, writing efficient PromQL queries becomes increasingly critical to ensure smooth performance and quick responses.
Here are some best practices and advanced techniques to optimize your PromQL queries for large-scale deployments and complex monitoring scenarios.
- Use label matching efficiently:
- Avoid using
{__name__=~".*"}which selects all metrics - Be specific with label matches to reduce the query scope
- Avoid using
- Leverage pre-recorded rules:
Create recording rules for frequently used queries
Example rule:
- record: job:http_requests_total:rate5m
  expr: rate(http_requests_total[5m])
- Optimize aggregation operations:
- Aggregate metrics at collection time when possible
- Use
withoutinstead ofbyfor excluding specific labels
- Best practices for performant queries:
- Avoid using
group_leftandgroup_rightfor large datasets - Use time-bounded range vectors (e.g.,
[5m]instead of[1h]) - Limit the use of regex in label matches
- Avoid using
Real-World PromQL Examples for Common Monitoring Scenarios
PromQL excels in practical applications, enabling engineers to monitor critical metrics like error rates, resource utilization, etc with ease.
Calculating Error Rates
sum(rate(http_requests_total{status=~"5.."}[5m])) / sum(rate(http_requests_total[5m])) * 100
This query calculates the percentage of HTTP 5xx errors over total requests.
Identifying Resource Bottlenecks
CPU usage:
100 - (avg by(instance) (rate(node_cpu_seconds_total{mode="idle"}[5m])) * 100)
Memory usage:
(node_memory_MemTotal_bytes - node_memory_MemAvailable_bytes) / node_memory_MemTotal_bytes * 100
Disk usage:
100 - ((node_filesystem_avail_bytes{mountpoint="/"} * 100) / node_filesystem_size_bytes{mountpoint="/"})
Monitoring Application-Specific Metrics
Response time percentiles:
histogram_quantile(0.95, sum(rate(http_request_duration_seconds_bucket[5m])) by (le, service))
This query calculates the 95th percentile of HTTP request durations across services.
Alerting on Anomalies
A sudden spike in error rate:
increase(http_requests_total{status=~"5.."}[5m]) > 10 * increase(http_requests_total{status=~"5.."}[5m] offset 5m)
This alert triggers if the number of errors in the last 5 minutes is 10 times higher than the previous 5-minute period.
Troubleshooting and Debugging with PromQL
PromQL is a versatile tool for identifying and resolving performance issues in your system. Here's how to make the most of it:
Identifying Outliers and Spikes
Use PromQL functions like max_over_time, quantile_over_time, or stddev_over_time to detect anomalies:
stddev_over_time(http_requests_total[5m]) > threshold
# Example: stddev_over_time(http_requests_total[5m]) > 200
This helps identify metrics with abnormal behavior, such as spikes or unexpected variance.
Correlating Metrics Across Services
Correlate metrics from different services to find root causes. For example:
rate(service_a_requests_total[1m]) / rate(service_b_requests_total[1m]
This can reveal bottlenecks or mismatches in service interactions.
Debugging Cardinality Issues
To find metrics with high cardinality:
topk(10, count by (__name__) ({__name__=~".+"}))
This query lists the top 10 metrics with the highest number of time series.
Handling Missing or Incomplete Data
To fill gaps in data with a default value:
http_requests_total or vector(0)
This query returns 0 for any missing data points in http_requests_total.
Extending Your Monitoring with SigNoz and PromQL
SigNoz is a comprehensive open-source APM and observability platform that complements Prometheus and extends PromQL capabilities. It provides:
Run PromQL Queries Directly in SigNoz: Use the built-in Metrics Explorer in SigNoz to run PromQL queries and visualize results instantly. You can craft, debug, and iterate on PromQL queries.
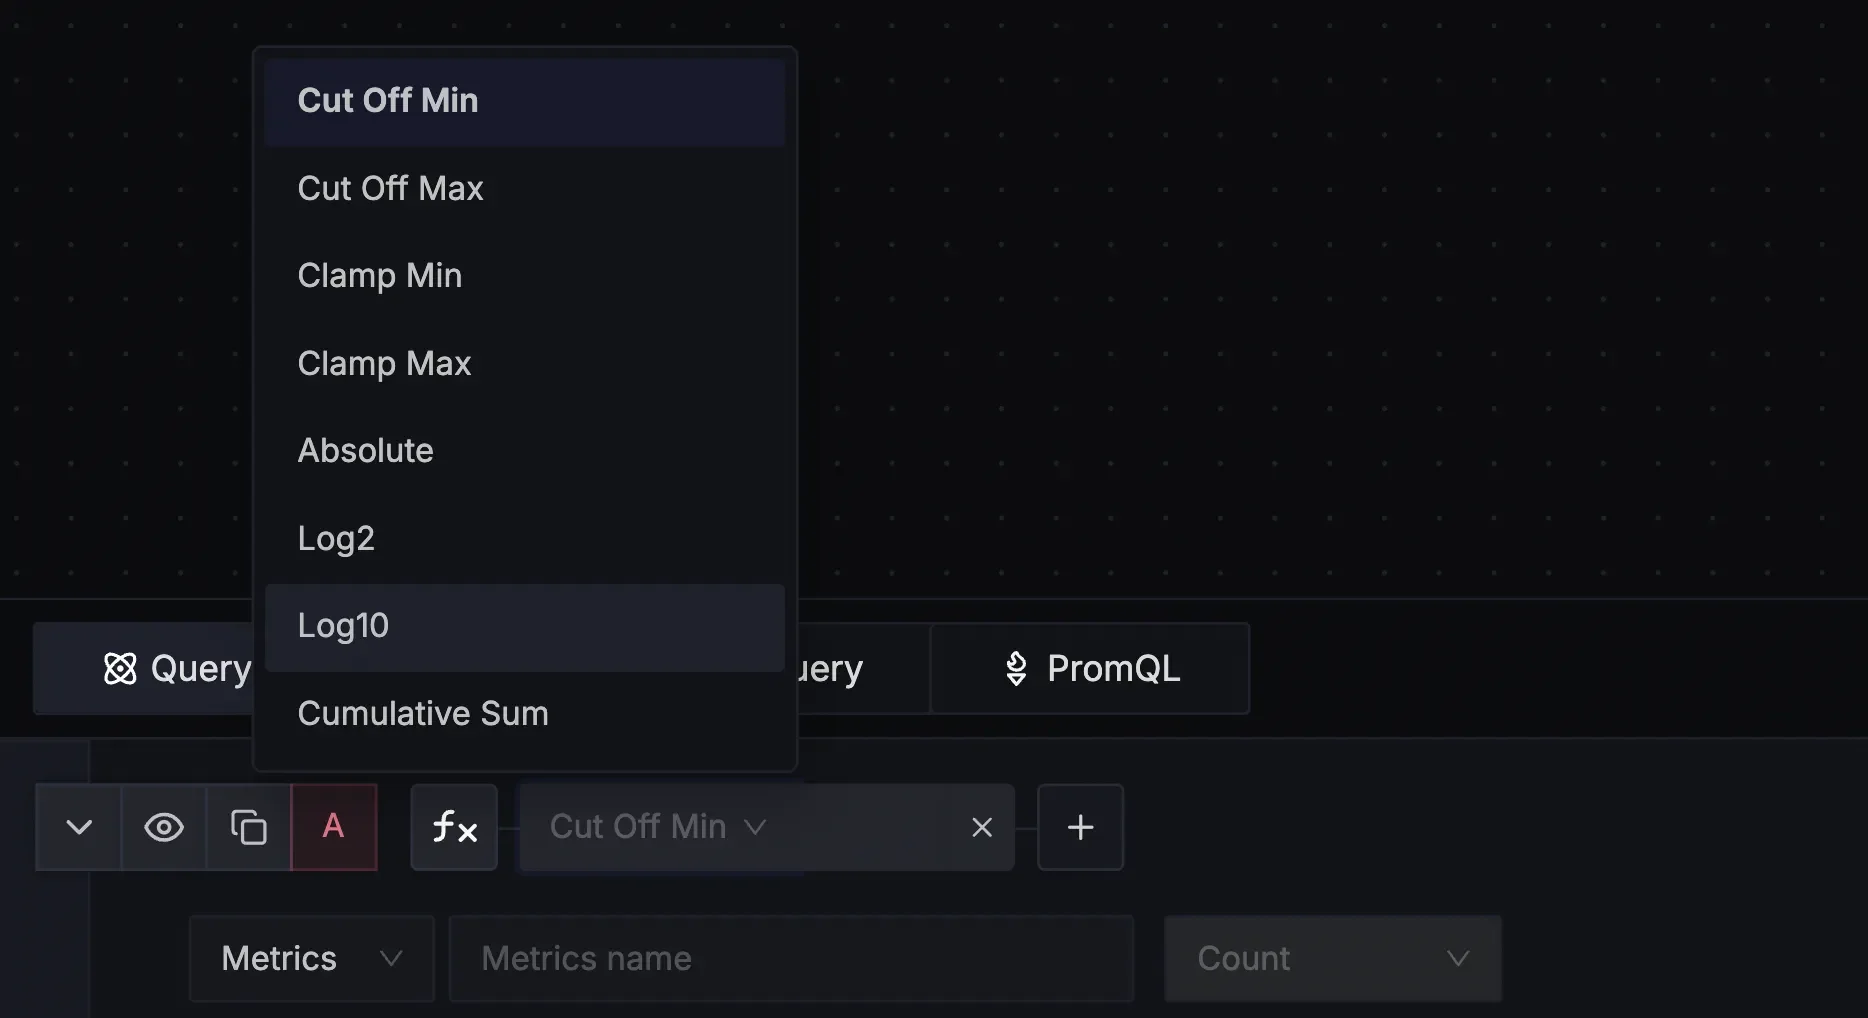
Built-in Functions in SigNoz 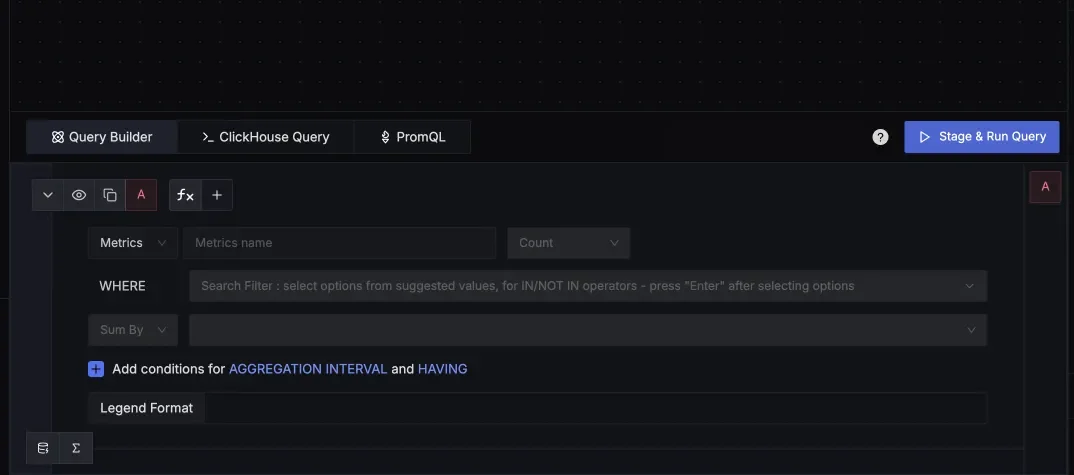
Query Builder SigNoz Enhanced visualization: SigNoz offers advanced dashboards and charts for PromQL queries.
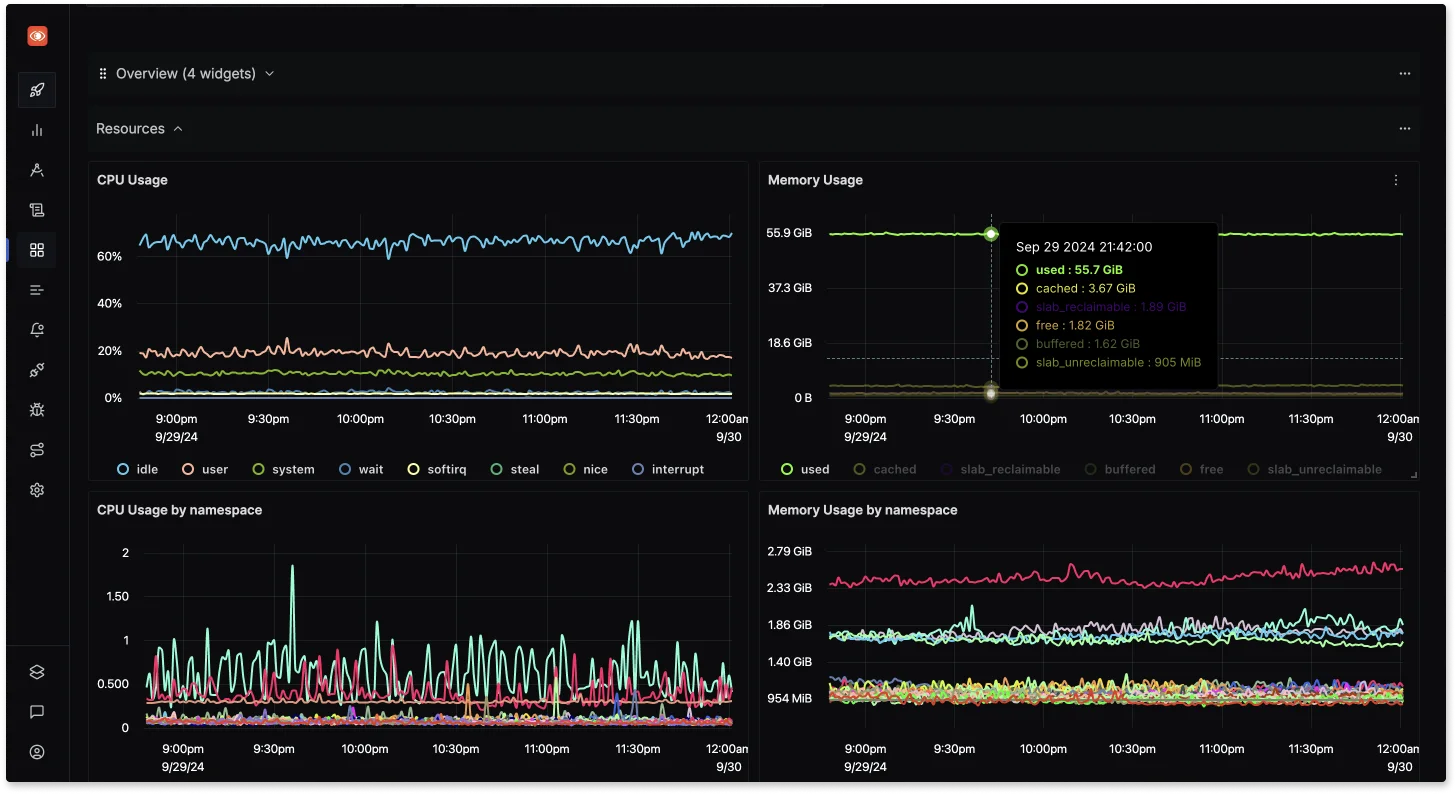
Custom Dashboards in SigNoz Trace correlation: Link PromQL query metrics to distributed traces within SigNoz to uncover root causes of performance bottlenecks. For example, trace high CPU utilization to specific services or requests.
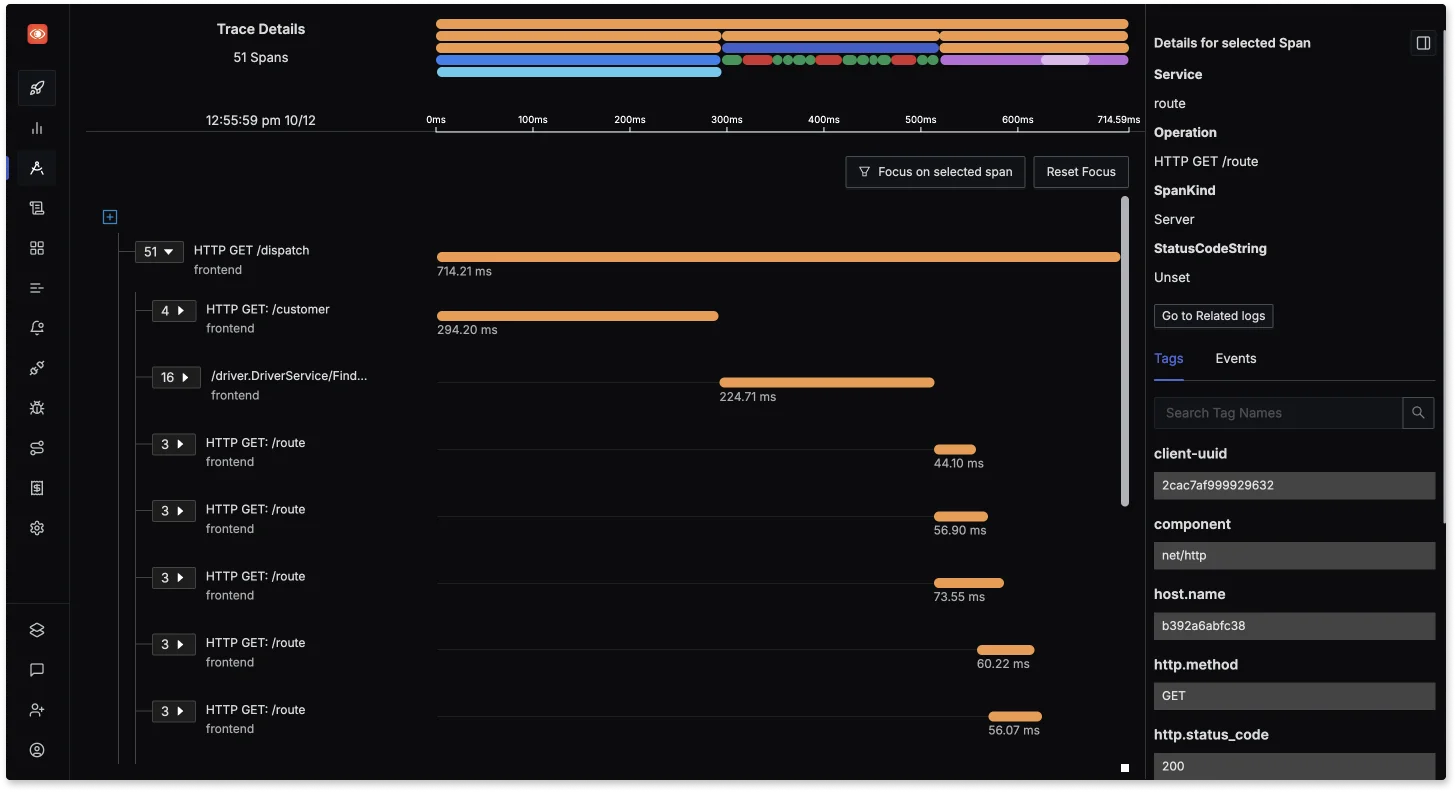
Distributed Tracing in SigNoz Long-term storage: While Prometheus has limited retention periods, SigNoz ensures you can analyze PromQL query results over extended durations, which is ideal for historical trends and capacity planning.
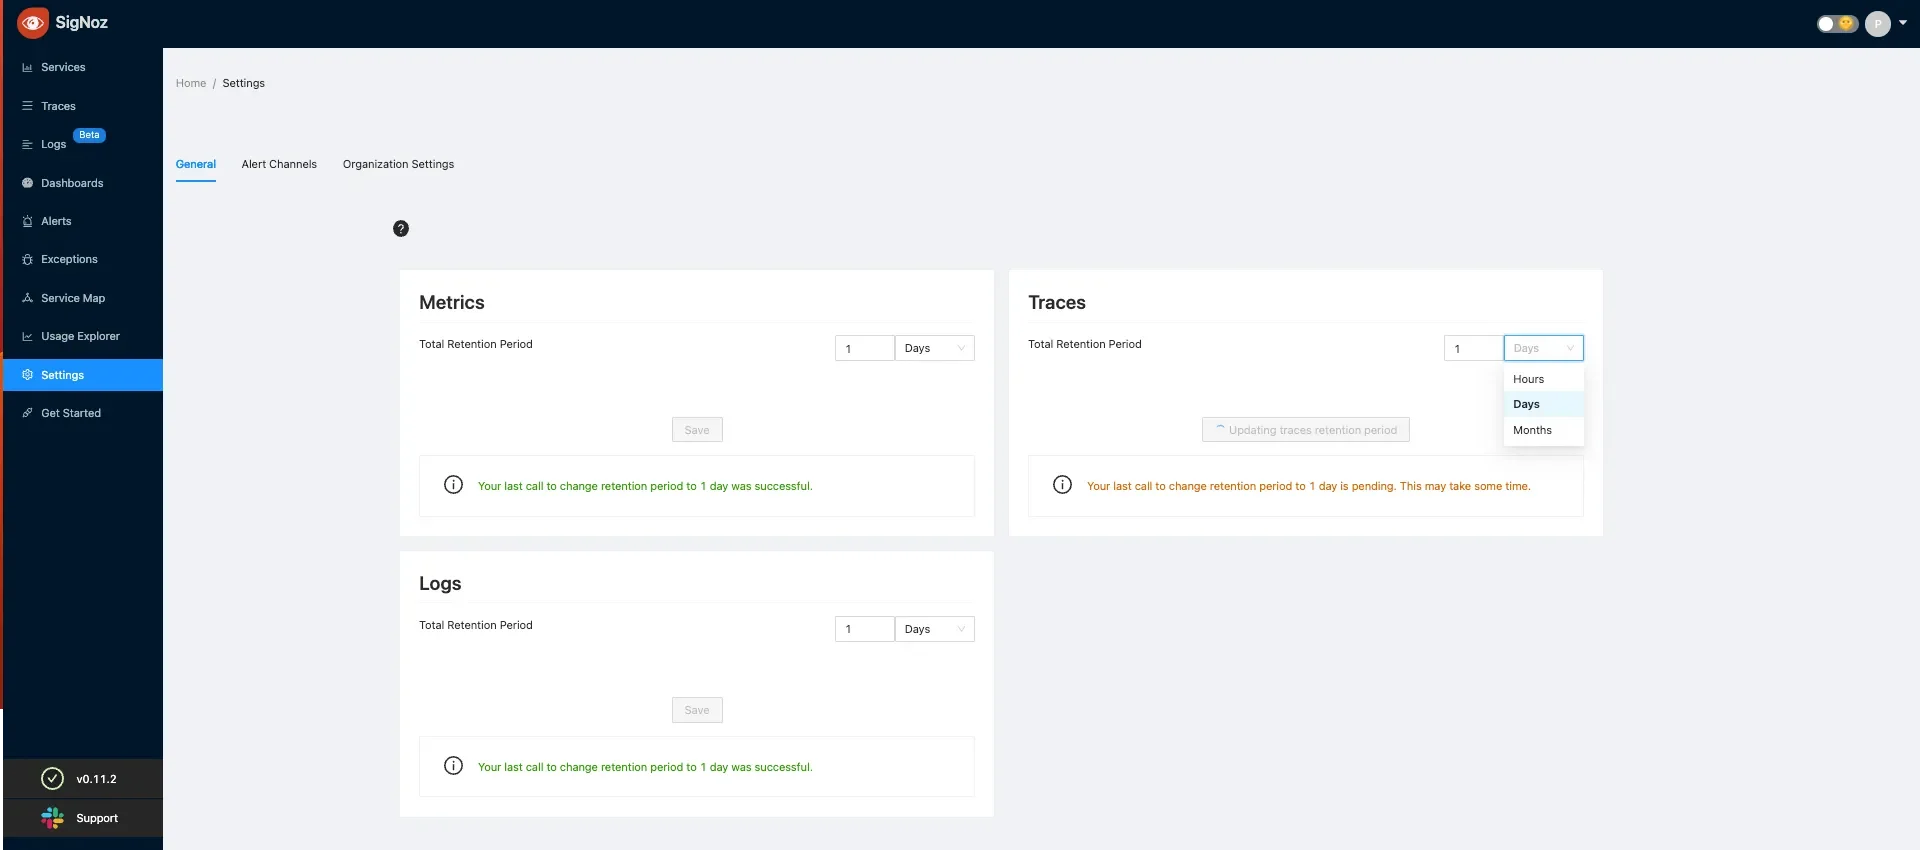
Retention Period in SigNoz Custom functions: Leverage SigNoz-specific functions and aggregations to perform deeper analysis that complements PromQL’s native capabilities.
SigNoz cloud is the easiest way to run SigNoz. Sign up for a free account and get 30 days of unlimited access to all features.
You can also install and self-host SigNoz yourself since it is open-source. With 19,000+ GitHub stars, open-source SigNoz is loved by developers. Find the instructions to self-host SigNoz.
By combining SigNoz with your existing Prometheus setup, you can create a powerful observability platform that enhances your PromQL capabilities and provides deeper insights into your systems.
Key Takeaways
- PromQL is essential for extracting insights from Prometheus metrics
- Master basic syntax and operators for effective metric querying
- Utilize common functions like
rate(),sum(), andhistogram_quantile()for comprehensive analysis - Optimize queries for performance in large-scale deployments
- Leverage advanced techniques for troubleshooting and anomaly detection
- Integrate tools like SigNoz to extend PromQL capabilities and enhance observability
FAQs
What are the most common PromQL functions for rate calculations?
The rate() function calculates the per-second average rate of change over a range vector, ideal for smooth trends, while irate() provides the instantaneous rate, useful for real-time spikes or anomalies.
How can I optimize PromQL queries for large-scale deployments?
Optimize queries by narrowing label matches, using pre-recorded rules for repeated queries, limiting range vectors, and avoiding high-cardinality labels to reduce processing overhead.
What's the difference between instant and range vector selectors in PromQL?
Instant vectors return the current value of a metric at a specific time, whereas range vectors include a series of values over a time window, enabling historical trend analysis.
How does PromQL handle missing or incomplete metrics data?
PromQL uses functions like absent() to detect missing metrics and absent_over_time() to check for gaps in data over a specified time window.

