Monitoring Kubernetes CronJobs can be challenging because they execute at scheduled times and often lack persistent metrics for Prometheus to scrape reliably. However, tools like the PushGateway, combined with custom metrics and effective configuration, can enable Prometheus to monitor these jobs effectively.
Prometheus collects essential CronJob metrics like execution status, duration, and failure rates to help you maintain reliable scheduled tasks in your Kubernetes cluster. This guide will walk you through the setup process, best practices, and advanced techniques to monitor CronJobs efficiently.
Understanding Kubernetes CronJobs and Monitoring Needs
Kubernetes CronJobs are a type of Kubernetes Job that runs periodically according to a specified schedule. They are useful for tasks like backups, report generation, and cleanup tasks. However, as they don’t run continuously, monitoring them requires a different approach than for services or deployments.
CronJobs presents unique challenges:
- Intermittent Execution: CronJobs runs only at specific times, so Prometheus may not have visibility if it misses the job's metrics during execution.
- Lack of Persistent Endpoints: Since CronJobs are ephemeral, you can't rely on scraping them directly as you would with continuously running applications.
- Error Handling: Understanding if a job failed and why can be difficult without tracking the right metrics and setting up effective alerts.
Key Metrics for CronJob Monitoring
Here are the essential metrics to track:
job_success: Indicates the number of successful job completions.job_error: Shows job failures.job_duration: Tracks how long jobs take to complete.job_retries: Counts retries (important for identifying instability).
Failures in CronJobs can lead to data inconsistencies, missed backups, or delayed processing, potentially affecting dependent services. Monitoring and alerting on job failures ensures you can respond quickly to prevent cascading issues.
Setting Up Prometheus for CronJob Monitoring
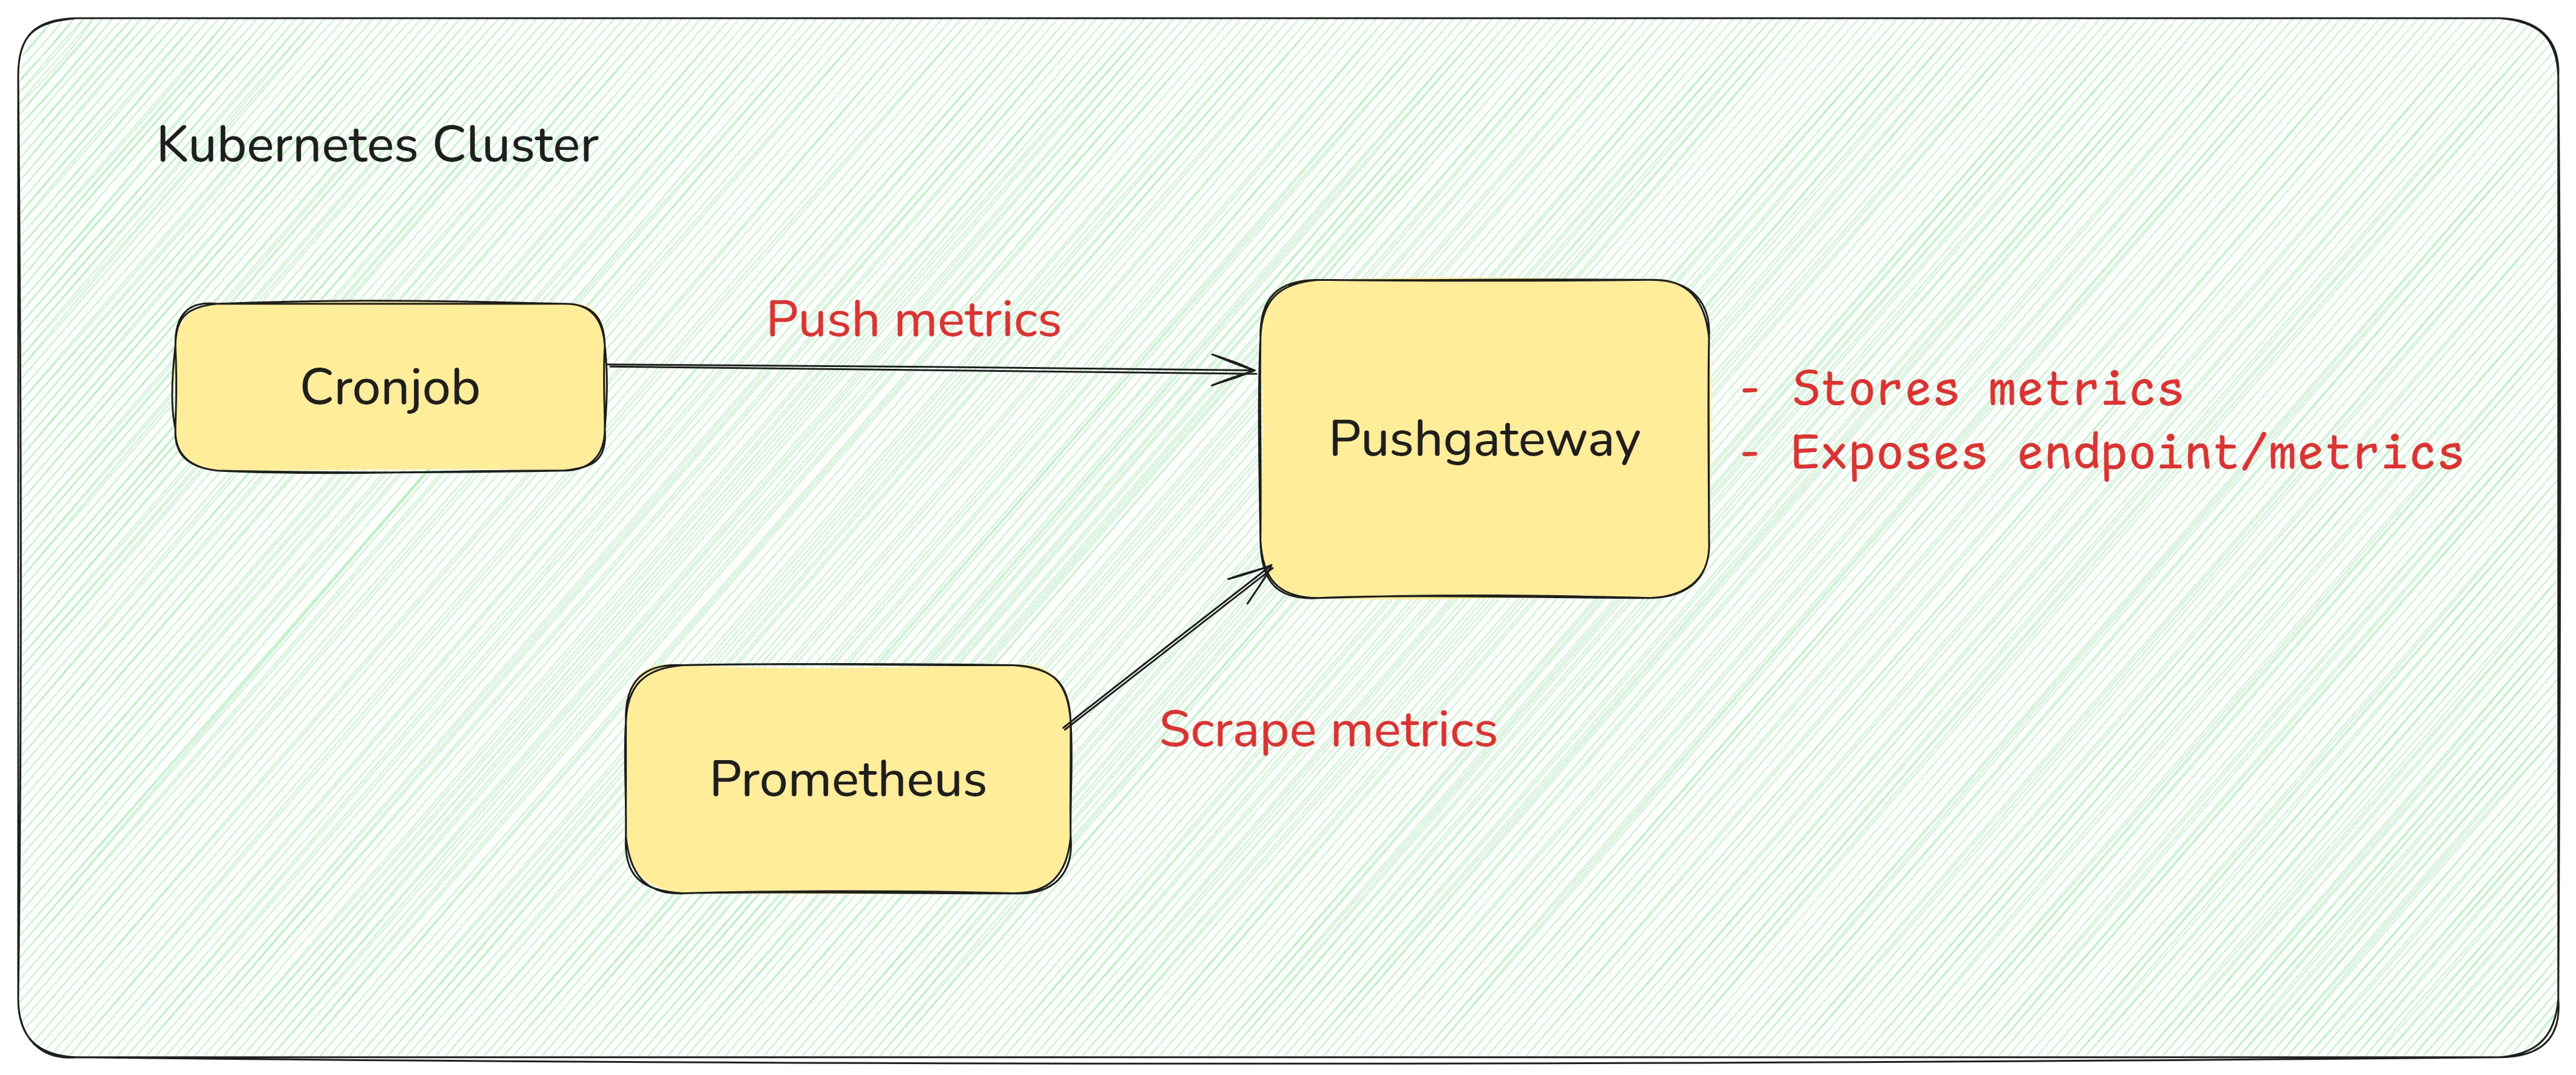
To monitor Kubernetes CronJobs effectively, you need to configure Prometheus to scrape metrics from your jobs. Here’s a guide to setting up Prometheus with direct configuration and using PushGateway for batch job metrics, which is crucial for CronJobs.
The monitoring setup:
Prerequisites for Prometheus Setup
Kubernetes Cluster: Ensure you have a running Kubernetes cluster.
Helm Installed: Helm is useful for installing and managing Prometheus in Kubernetes.
Prometheus and PushGateway: Install Prometheus and PushGateway. They can be installed using Helm or other tools, as long as they are configured to communicate within the cluster.
helm install prometheus prometheus-community/kube-prometheus-stack
helm install pushgateway prometheus-community/prometheus-pushgateway
Verify the installation using the command
kubectl get pods.
Prometheus and PushGateway Installation Verification The
-n monitoringfilters out the list of pods in the namespace namemonitoring.
Note: By default, PushGateway exposes metrics at the /metrics endpoint, so you don’t need to specify this path explicitly in the Prometheus configuration. Prometheus will look for it automatically.
Deploy a CronJob
Next, create a simple CronJob in Kubernetes that runs every 5 minutes and simulates pushing metrics to the PushGateway.
Step 1: Create the CronJob YAML file
Create a file called cronjob.yaml with the following content:
apiVersion: batch/v1
kind: CronJob
metadata:
  name: test-cronjob
  namespace: default
spec:
  schedule: "*/1 * * * *"  # Runs every 1 minute
  jobTemplate:
    spec:
      template:
        spec:
          containers:
          - name: test-cronjob
            image: curlimages/curl:latest
            args:
              - /bin/sh
              - -c
              - |
                echo "new: Pushing metrics to PushGateway"
                # Push a simulated metric to the PushGateway
                echo 'example_metric{job="test-cronjob"} 1' | curl --data-binary @- http://pushgateway-prometheus-pushgateway.monitoring.svc.cluster.local:9091/metrics/job/test_cronjob
            env:
              - name: PUSHGATEWAY_URL
                value: "pushgateway-prometheus-pushgateway.monitoring.svc.cluster.local:9091"
          restartPolicy: OnFailure
Step 2: Apply the CronJob
Apply the CronJob configuration to the cluster:
kubectl apply -f cronjob.yaml
This CronJob will attempt to push a metric named example_metric to PushGateway every 5 minutes.
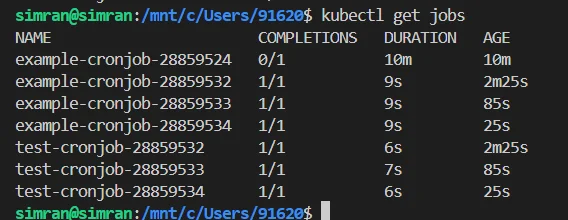
Check if your cronjob is configured properly by running the command kubectl get jobs:
2. Create a Secret for Scraping Metrics from PushGateway
To allow Prometheus to scrape metrics from PushGateway, create a Secret with custom scrape configurations.
Step 1: Create the Secret
Create a file called additional-scrape-configs.yaml with the following content:
apiVersion: v1
kind: Secret
metadata:
  name: additional-scrape-configs
  namespace: monitoring
stringData:
  additional-scrape-configs.yaml: |
    - job_name: 'pushgateway'
      static_configs:
        - targets: ['pushgateway-prometheus-pushgateway.monitoring.svc.cluster.local:9091']
Step 2: Apply the Secret
Apply the Secret to your Kubernetes cluster:
kubectl apply -f additional-scrape-configs.yaml
3. Update the Prometheus Custom Resource to Use the Additional Scrape Configuration
The next step is to configure the Prometheus Custom Resource (CR) to reference this Secret, which will enable Prometheus to scrape metrics from PushGateway.
Find the Prometheus Custom Resource in your cluster:
kubectl get prometheus -n monitoring
Find the Prometheus Custom Resource Once you’ve identified the name of your Prometheus CR, edit it:
kubectl edit prometheus <your-prometheus-cr-name> -n monitoring
Editing the Custom Resource In the
specsection of the Prometheus CR, add a reference to the new Secret you just created:spec: additionalScrapeConfigs: name: additional-scrape-configs key: additional-scrape-configs.yamlSave and exit the editor. The Prometheus Operator will automatically detect and apply the additional scrape configurations.
Tip: The /metrics endpoint on PushGateway is the default for Prometheus to scrape metrics, so you don’t need additional configuration for the path unless you are using a custom endpoint.
4. Verification
To confirm that Prometheus is now scraping metrics from PushGateway, check the Prometheus UI:
- Open the Prometheus UI in your browser.
- Go to Status > Targets and verify if the PushGateway target is listed and actively being scraped.

By completing these steps, Prometheus will now collect metrics from the PushGateway, allowing you to monitor your CronJob's metrics effectively.
5. Enable Dynamic Target Discovery with a ServiceMonitor
If you're using the Prometheus Operator, configuring a ServiceMonitor is required. The Operator relies on ServiceMonitors to dynamically discover and scrape targets like PushGateway.
Step 1: Create a Service monitor
Define a ServiceMonitor to target PushGateway. Create a file named servicemonitor-pushgateway.yaml with the following content:
apiVersion: monitoring.coreos.com/v1
kind: ServiceMonitor
metadata:
  name: pushgateway-monitor
  namespace: monitoring
spec:
  selector:
    matchLabels:
      app: pushgateway
  endpoints:
  - port: web
    interval: 15s
  namespaceSelector:
    matchNames:
    - monitoring
selector.matchLabels: Ensures that the ServiceMonitor matches the correct PushGateway service using its labels.namespaceSelector.matchNames: Ensures the service is discovered in themonitoringnamespace.
Step 2: Apply the ServiceMonitor
Deploy the ServiceMonitor to your cluster:
kubectl apply -f servicemonitor-pushgateway.yaml
(Optional) Adjust PushGateway Service Labels
If Prometheus doesn't detect the PushGateway service, ensure it has the correct labels by running:
kubectl patch svc pushgateway-prometheus-pushgateway -n monitoring -p '{"metadata":{"labels":{"app":"pushgateway"}}}'
Why Use a ServiceMonitor?
- Dynamic Target Discovery: Unlike static configurations, ServiceMonitors enable Prometheus to dynamically discover scrape targets in Kubernetes.
- Operator Integration: ServiceMonitors are the standard for Prometheus Operator deployments, ensuring seamless integration with other resources.
- Scalability: As targets scale or change in the cluster, Prometheus automatically adjusts without manual updates to configurations.
Label Selection Strategy
Label selection is crucial for ensuring that your Prometheus metrics are meaningful, easy to query, and aligned with your monitoring goals. For CronJob monitoring, you'll need to use appropriate labels that reflect the identity of each CronJob, its execution status, and other relevant attributes.
Steps to Define Label Selection:
- Job Names and Identifiers:
- Include a label for the CronJob name to uniquely identify each CronJob in your metrics.
- Example:
job_name="<your_cronjob_name>".
- Namespace:
- Add a label for the namespace in which the CronJob is running, especially if you’re managing multiple environments.
- Example:
namespace="<namespace>".
- Status:
- Track job statuses such as
successorfailurewith specific labels likestatus="<success/failure>".
- Track job statuses such as
- Instance or Pod Information:
- For detailed monitoring, include pod name or instance as a label for identifying which pod is being monitored in case of failures or issues.
- Example:
instance="<pod_name>".
- Custom Labels:
- If needed, you can also use additional labels such as priority or job type to filter and aggregate your metrics more effectively based on your monitoring needs.
Example Label Definition:
job_name: "example-cronjob"
namespace: "default"
status: "success"
instance: "example-cronjob-pod-1234"
Configuring Job Metrics
Here’s how you can set up and configure job metrics for your CronJob monitoring:
Job Success/Failure Metrics
Job success and failure metrics help track the success rate and failure rate of your CronJobs. These metrics allow you to see at a glance whether your CronJob is running successfully or failing.
Example Metric for Success and Failure:
# Job Success Metric
job_success{job="example-cronjob", status="success"} 1  # Job ran successfully

# Job Failure Metric
job_success{job="example-cronjob", status="failure"} 0  # Job failed
Here’s a breakdown:
- job_success: This metric is used to indicate the success or failure of a job. It can be either
1(success) or0(failure). You can set this metric based on the CronJob’s outcome. - Usage: After the CronJob runs, your system will update this metric with
1for a successful execution or0for a failed execution.
Job Duration
Job duration tracks how long a CronJob takes to execute, measured in seconds. This helps you identify CronJobs that are taking longer than expected or may be experiencing performance issues.
Example Metric for Job Duration:
# Job Duration Metric
job_duration_seconds{job="example-cronjob"} 45.2  # CronJob took 45.2 seconds
- job_duration_seconds: This metric captures the execution duration in seconds.
- Usage: After each CronJob execution, you can record its duration in the metric, helping to track performance over time. For instance, if a CronJob's duration consistently increases, it might indicate a performance bottleneck that requires attention.
Note: You can add these metrics by updating the cronjob scripts.
Configuring Alerting Rules
To stay informed of any issues with your CronJobs, set up alerting rules based on the metrics you’ve collected.
Alert for CronJob Failures:
- An alert rule that fires when any CronJob fails more than a specified number of times within a given period.
Example Alert Rule:
groups:
- name: cronjob_alerts
  rules:
  - alert: CronJobFailed
    expr: job_error{job_name="example-cronjob", status="failure"} > 3
    for: 5m
    labels:
      severity: critical
    annotations:
      summary: "CronJob example-cronjob has failed 3 times in the last 5 minutes"
Alert for Long-Running CronJobs:
- You can also set up an alert rule to notify you if a CronJob runs longer than expected.
Example Alert Rule:
groups:
- name: cronjob_alerts
  rules:
  - alert: CronJobDurationTooLong
    expr: job_duration_seconds{job_name="example-cronjob", status="success"} > 300
    for: 5m
    labels:
      severity: warning
    annotations:
      summary: "CronJob example-cronjob took longer than expected"
Note: The alert updates need to be added to the Prometheus configuration file
To verify if the alerts are firing:
- Access Prometheus Alerting Page: Go to the Prometheus UI (
http://<prometheus-server>:9090/alerts). - Check Alerts: You should see the alerts like
CronJobFailedandCronJobDurationTooLongif your simulated conditions met the threshold.
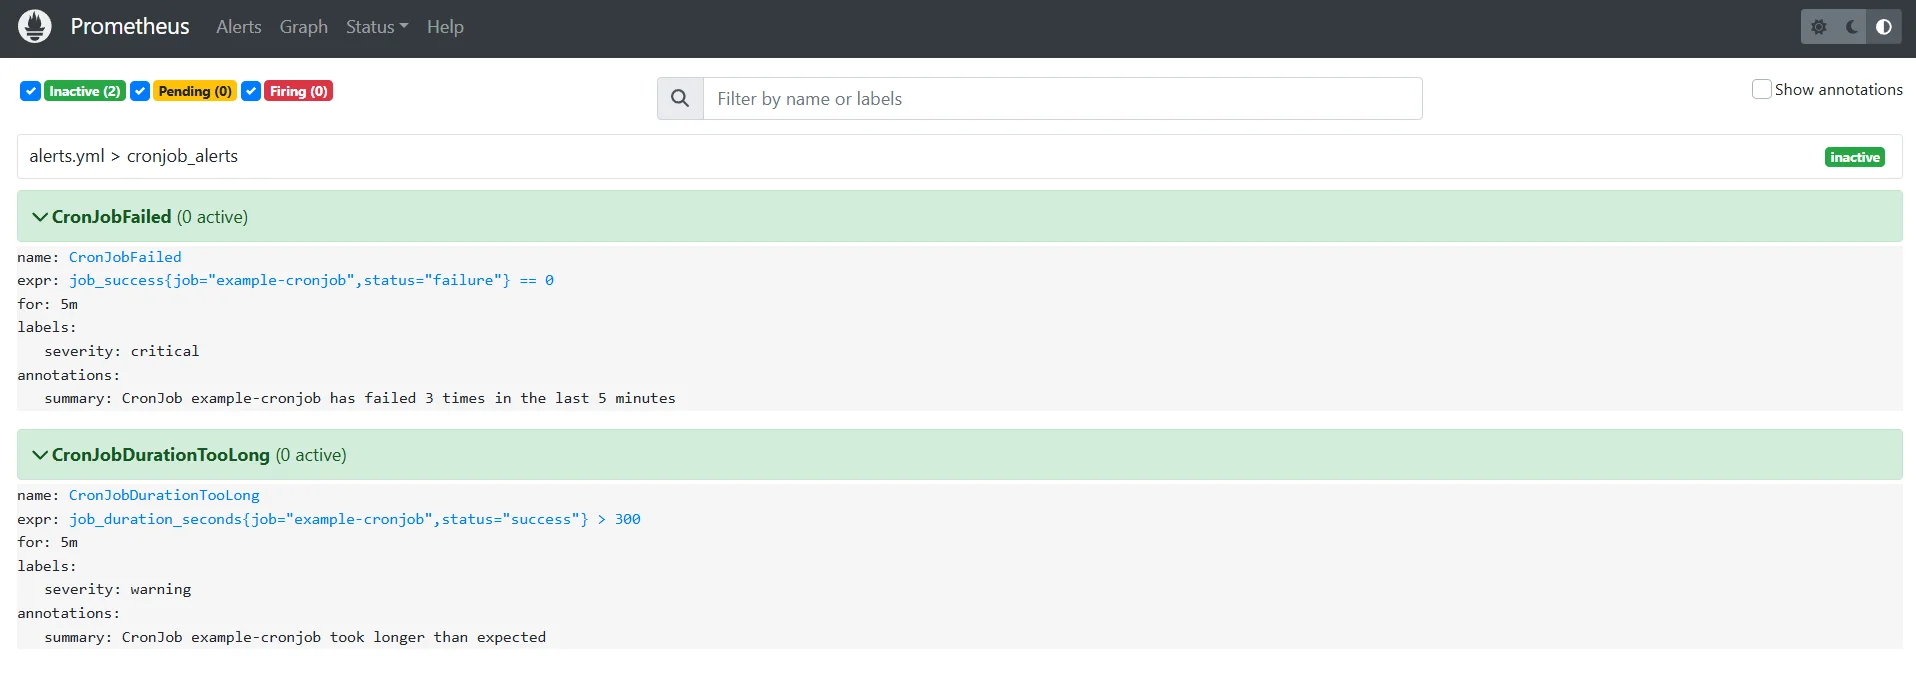
Configuring Alerting Rules for K8s CronJob
Implementing Monitoring Best Practices
To ensure your CronJobs are properly monitored and perform efficiently, follow these best practices:
Using Custom Metric Labels: Customize your metric labels for better granularity and filtering. For example, include labels like
job_name,status,environment, andscheduleto categorize CronJob executions and easily filter metrics in Prometheus or Grafana. This helps with better visibility and tracking of different job states (e.g.,job_success,job_failure).Example:
job_success{job="example-cronjob", status="success", environment="production"} 1Setting Up Meaningful Alerts: Configure alerts based on job failures, durations, or other key metrics. Set severity levels for alerts (e.g.,
critical,warning) and ensure that annotations provide context for troubleshooting. For example, alert when a job exceeds a set duration or fails more than a specified number of times.Example Alert for Failures:
groups:
- name: cronjob_alerts
  rules:
  - alert: CronJobFailed
    expr: job_error{job_name="example-cronjob", status="failure"} > 3
    for: 5m
    labels:
      severity: critical
Handling Job Timeouts: Set reasonable timeouts for your CronJobs to prevent them from running indefinitely. If a job exceeds the time limit, consider aborting it to free up resources. Use Kubernetes'
timeoutSecondsor implement timeouts within the job itself.Example Timeout in CronJob YAML:
containers:
- name: cronjob-container
  image: your-cronjob-image
  args:
  - /bin/bash
  - -c
  - "timeout 300s your-script.sh"  # Timeout after 5 minutes
Implementing Retry Mechanisms: Use retries to handle temporary failures due to issues like resource contention or transient errors. Set a backoff policy for retries and a maximum retry limit to avoid infinite retry loops.
Example Retry in CronJob YAML:
restartPolicy: OnFailure
backoffLimit: 3  # Retry up to 3 times
Advanced Monitoring with SigNoz
SigNoz is an open-source observability platform that provides comprehensive monitoring for your CronJobs.
It helps track key performance metrics, such as job success rates, execution durations, and failure counts, all in real time.
SigNoz's ability to collect and visualize these metrics in intuitive dashboards allows you to quickly identify issues, optimize job performance, and ensure that your CronJobs run smoothly.
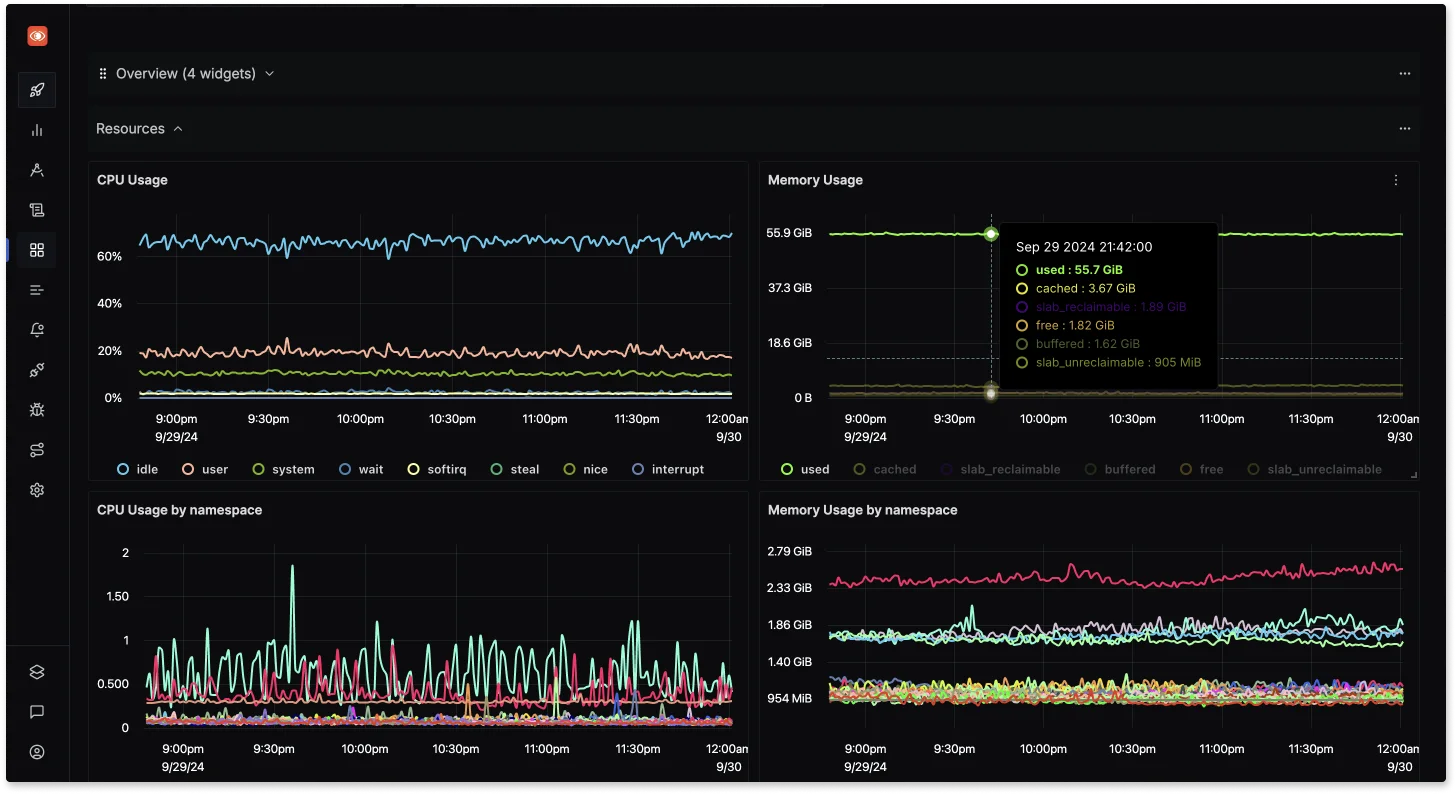
SigNoz: metrics and dashboards With advanced alerting capabilities, SigNoz can notify you of critical failures or performance bottlenecks, making it an essential tool for proactive monitoring and faster troubleshooting.
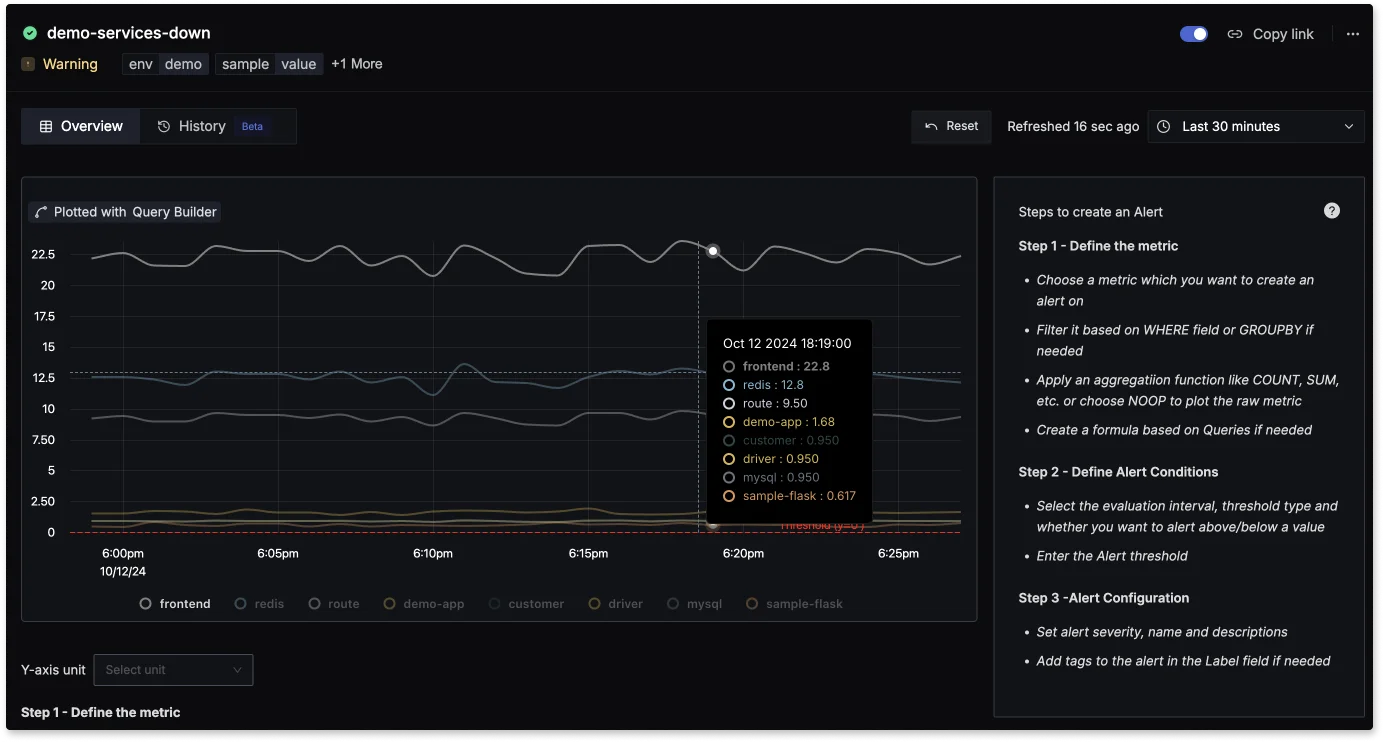
SigNoz: Alerting Capabilities
SigNoz cloud is the easiest way to run SigNoz. Sign up for a free account and get 30 days of unlimited access to all features.
You can also install and self-host SigNoz yourself since it is open-source. With 19,000+ GitHub stars, open-source SigNoz is loved by developers. Find the instructions to self-host SigNoz.
Check out the following articles to send metrics to SigNoz:
By utilizing SigNoz's cloud offering, built-in dashboards, and powerful alerting features, you can implement a robust monitoring solution that not only tracks CronJob performance but also proactively alerts you to any potential issues, enabling faster response and resolution.
Creating Effective Dashboards
When building dashboards to monitor your CronJobs, it’s important to focus on essential metrics and organize them for clarity and usability.
- Essential Metrics to Display:
- Job Success/Failure: Track the success and failure of CronJobs.
- Job Duration: Visualize the execution time to spot performance issues.
- Job Error Rate: Monitor failures over time to ensure system health.
- Dashboard Organization Tips:
- Group related metrics, such as success rate and failure rate, in a single panel for easy comparison.
- Prioritize high-impact metrics like failure rates or long-running jobs at the top of the dashboard for immediate visibility.
- Visualization Best Practices:
- Use line graphs to show trends in job success and duration over time.
- Opt for heat maps or bar charts to highlight failure rates or anomalies.
- Alert Correlation Setup:
- Link alerts to specific dashboard panels to make it easier to investigate issues immediately when an alert is triggered.
- Use annotations or color coding on graphs to highlight time periods when alerts were fired, aiding quicker troubleshooting.
Key Takeaways
- Prometheus is ideal for CronJob monitoring, offering powerful querying and scalability for real-time data.
- PushGateway is crucial for batch job metrics, ensuring short-lived CronJobs can be monitored.
- Proper labeling is essential for categorizing and filtering metrics effectively.
- Regular dashboard maintenance is important for keeping monitoring insights accurate and useful.
FAQs
What metrics should I monitor for CronJobs?
For effective monitoring, focus on job success, failure, duration, and error rates. These metrics help you track the performance of your CronJobs, spot failures quickly, and identify performance bottlenecks.
How do I handle job failures in Prometheus?
To handle job failures, set up alerting rules based on metrics like job_success and job_error. These rules can notify you when a CronJob fails multiple times, allowing for quick response and troubleshooting.
Can I monitor multiple CronJobs with one configuration?
Yes, you can monitor multiple CronJobs using a single Prometheus configuration by differentiating them through labels. This allows you to collect metrics from various CronJobs under the same setup.
What's the difference between push and pull metrics?
Push metrics are sent by jobs to a collector like PushGateway, which is then scraped by Prometheus. In contrast, pull metrics are retrieved directly by Prometheus from endpoints at specified intervals, with Prometheus actively polling the targets.

